How Efficiency Protects Long-Term Yacht Value

How Efficiency Protects Long-Term Yacht Value

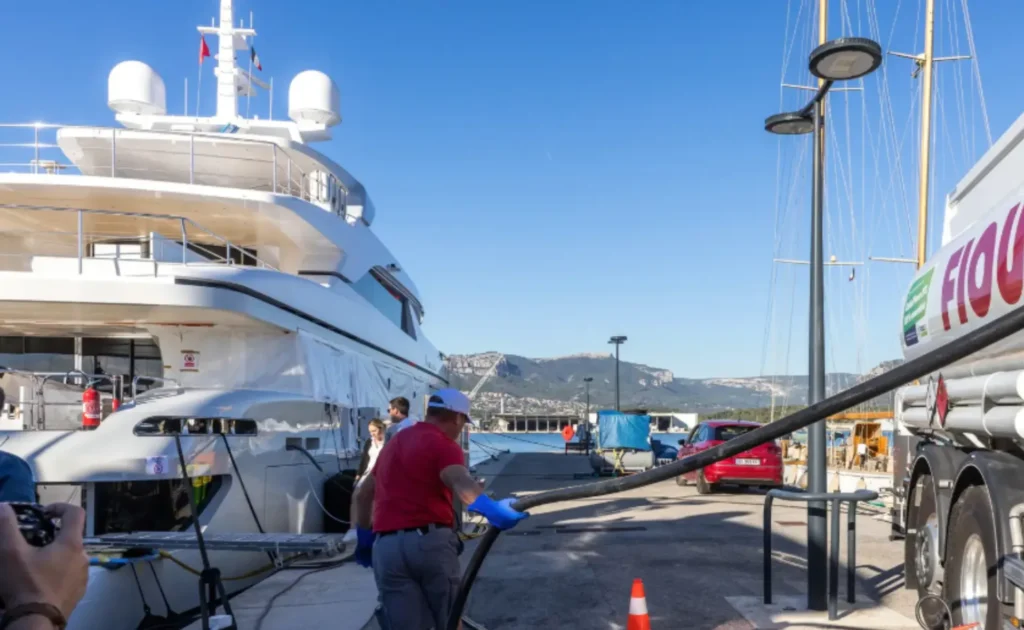
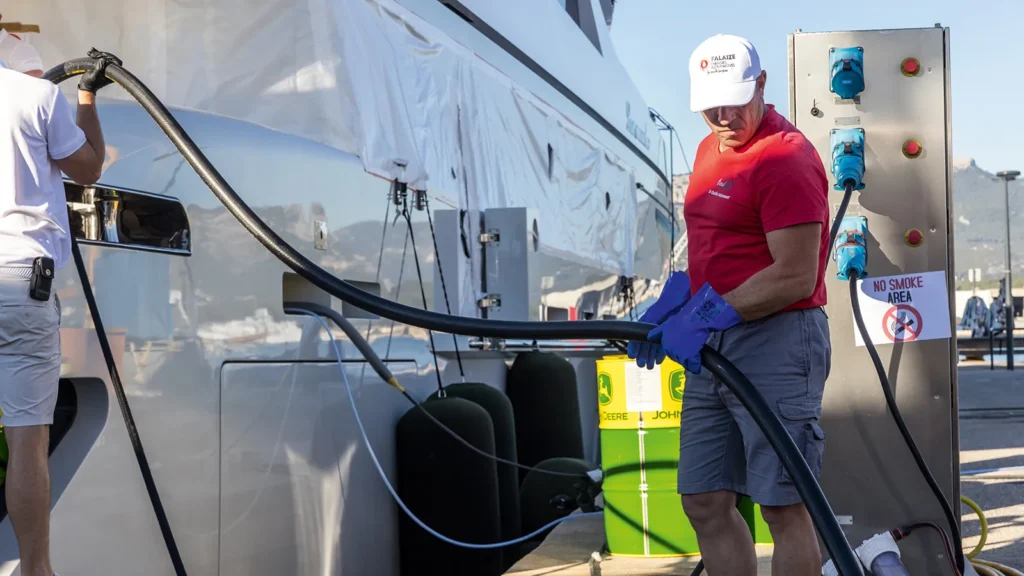
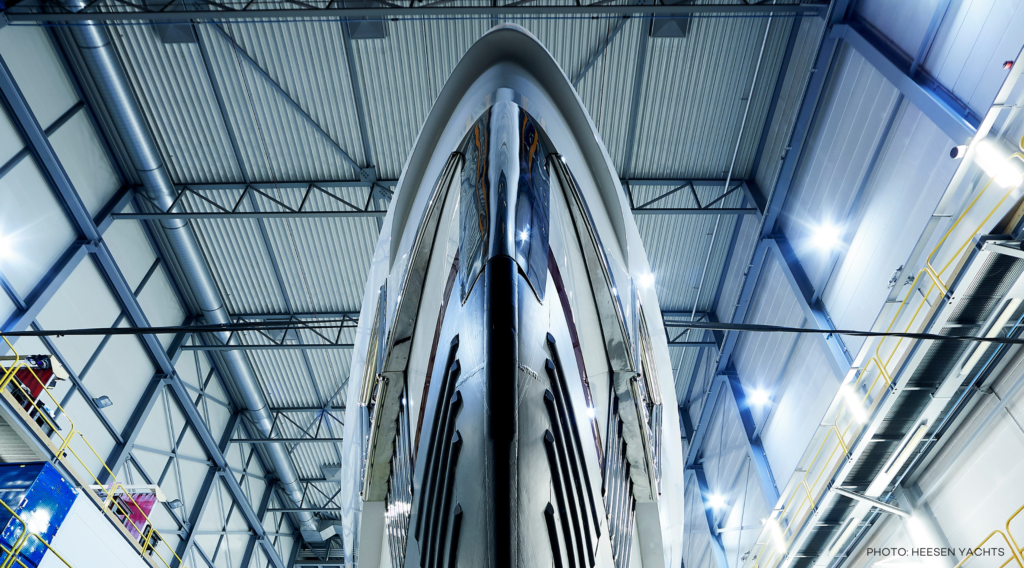
Efficiency is not simply an operational consideration. For yacht owners, the decisions made around refit, machinery and energy use can have a direct bearing on long-term operating costs and resale value.

Our latest Smart Ownership article examines how the way a yacht is designed, operated and upgraded can influence its value over time — and why efficiency improvements need to be measured, timed and transferable to the next owner.

The article explores:

🔹 Why many yachts operate with oversized generation systems, leaving them outside their most efficient load range for much of their working life.

🔹 Why efficiency savings recorded by one owner do not automatically translate into value for the next — and the importance of independently measurable data.

🔹 How life-cycle assessment can reveal the trade-offs between different technologies, from lightweighting and battery storage to antifouling systems.

🔹 Which improvements can deliver the greatest returns, from hull condition and HVAC optimisation to propulsion and hybrid systems.

🔹 Why planning upgrades around scheduled surveys and repower windows can reduce costs and make efficiency improvements more practical.

The decisions made today can determine not only what it costs to operate in the years ahead, but how those improvements are understood and valued by the next owner.

Read the full article

Your product is someone else’s Scope 3 problem

Your product is someone else’s Scope 3 problem

The EU Corporate Sustainability Reporting Directive (CSRD) is forcing the companies that buy from you to account for the carbon emissions embedded in everything they purchase. Whether you provide verified data or not, your products will be counted.

The biggest question is whether your buyers use your numbers, or make up their own.


A meeting that is already happening without you

Right now, across the yachting sector, buyers are building Scope 3 inventories. They are going through their supplier lists, and assigning carbon emission factors to every significant purchase they make from you.

If you have provided verified environmental data, a product carbon footprint, an Environmental Product Declaration, a third-party verified LCA, they use your numbers. If you have not, they use industry averages, which are almost always higher than a supplier’s actual performance, because they are designed to be conservative.

In practice, Scope 3 reporting happens with or without supplier participation. The only question is whether the numbers used represent the product itself or a generic estimate.

What Scope 3 emissions are, and why they reach your workshop

The GHG Protocol divides emissions into three scopes. Scope 1 covers direct emissions, Scope 2 covers purchased electricity, and Scope 3 includes emissions generated throughout a company’s value chain.

For a shipyard building or refitting a yacht, Scope 3 is typically the largest category, often accounting for 70 to 90 per cent of their total carbon footprint. The biggest driver is purchased goods and services: the steel, GRP, timber, coatings, systems, and equipment that go into the vessel.

That means your products. Every tonne of material or component supplied carries an embedded carbon footprint that the buyer is now required under law, for the largest companies to account for.


The three numbers that matter

For any given purchase, a Scope 3 Category 1 (purchased goods and services) calculation requires three things:

  • The quantity purchased (weight, volume, or units)
  • The emission factor for that product category (kg CO₂e per unit, from a database or supplier-provided data)
  • The data quality (whether the emission factor is verified supplier-specific data, or a generic estimate)

Most buyers are currently working with the third option, generic estimates from databases like ecoinvent, the GHG Protocol sector guidance, or industry association averages. These numbers are often accurate at a sector level but poorly representative of any individual supplier’s actual manufacturing process, material sourcing, or energy mix.

A supplier who has run an LCA and can provide a verified product carbon footprint replaces that generic estimate with a real number, reflecting the accurate commercial standing of your product.


Where the legal pressure comes from: CSRD explained in three paragraphs

The EU Corporate Sustainability Reporting Directive (CSRD) requires large companies to publish sustainability reports aligned with the European Sustainability Reporting Standards (ESRS).

ESRS E1, the climate standard, requires companies to disclose their full greenhouse gas emissions including Scope 3 Category 1 (purchased goods and services). This is not a voluntary disclosure. It is audited, published, and increasingly used by investors, lenders, and procurement teams as a basis for decisions.

What this means in practice:  for the yachting sector, the companies most affected by CSRD are the larger shipyards, refit facilities, yacht management companies and charter operators. Much of their Scope 3 footprint sits within their supply chains, making compliance, in part, a data collection challenge. A shipyard in scope is required to report emissions from purchased goods and services as part of its CSRD submission and therefore depends on material and equipment suppliers to provide verified product-level environmental data. Where that information is unavailable, buyers must fill the gap using estimates, and those estimates become the figures reported publicly.

The IMO runs a parallel track

While CSRD creates Scope 3 pressure from the EU corporate reporting side, the International Maritime Organisation (IMO) is creating parallel pressure from the vessel operational side.

Through measures such as the Data Collection System (DCS) and Carbon Intensity Indicator (CII) require operators of vessels above 5,000 GT to report and improve fuel efficiency. The IMO’s 2023 revised GHG Strategy targets net-zero emissions from international shipping by or around 2050, with interim milestones in 2030 and 2040.

As a result, owners and operators are paying close attention to the weight, energy consumption, and carbon intensity of the equipment and materials on their vessels. A hull coating that reduces drag and improves fuel efficiency is a carbon reduction tool. A lightweight composite component is contributing to a vessel’s GHG profile.

Suppliers who can quantify this contribution in verified terms: ‘our product reduces vessel fuel consumption by X per cent over a ten-year service period, representing Y tonnes of CO₂ avoided’, have a commercial argument that maps directly onto an operator’s IMO compliance challenge. That argument requires an LCA.


What actually happens to suppliers without verified data

The consequences of not having verified environmental data are not immediate but they compound over time.

In the short term: you get estimated, not measured: Buyers assign generic emission factors from databases and industry averages, which may not reflect your specific manufacturing processes, material inputs or energy sourcing. For suppliers who have invested in efficiency may therefore appear to have a higher footprint than they actually do.

In the medium term: you become harder to include in verified reporting: As CSRD reporting matures and auditors scrutinise data quality, buyers will face pressure to improve the accuracy of their Scope 3 inventories. The first step is replacing generic factors with supplier-specific verified data. Suppliers who cannot provide this may be replaced on preferred supplier lists, or will face specific requests.

In the longer term: procurement criteria evolve: Several major European shipyards and superyacht builders have already introduced sustainability criteria into their supplier qualification processes. These criteria are currently soft; questionnaires, self-declarations, policy statements. Within two to three years, as CSRD reporting increases and buyers face audit scrutiny on Scope 3 data quality, those criteria will harden. Verified product carbon footprint data and a third-party verified data will be the baseline for inclusion.

The window:  Suppliers who act in 2026 and 2027 have an opportunity to build this capability before it becomes a hard requirement, giving them flexibility and the strongest position when buyers come asking.


What verified data looks like and what it does not require

The term ‘verified environmental data’ can sound like a large, expensive undertaking. In practice, what buyers needs for Scope 3 reporting is more specific and more achievable than most suppliers assume.

At minimum, buyers need a product carbon footprint expressed in kg CO₂ equivalent per functional unit for example, per kilogram of product, per litre, per square metre of applied coating, or per unit shipped. This number should be derived from a recognised methodology (ISO 14067 for product carbon footprints, or EN 15804 for EPDs) and verified by an independent third party.

That does not require a full cradle-to-grave LCA for every product in your range on day one. A credible starting point is typically a gate-to-gate or cradle-to-gate calculation covering the production stage, where most of a manufactured product’s carbon footprint sits and where you have the most direct data access.

The process involves three core inputs: your bill of materials (what goes into the product), your energy consumption in production, and your transport data. Most suppliers have this information in some form already. The challenge is usually not the lack of data, but data organisation and methodology application.


What the numbers tell you beyond the buyer’s report

A product carbon footprint calculation tells you more than how compliant you are. It highlights where your emissions are concentrated within the manufacturing process, which materials, energy use, and transport legs. For most manufacturers, this reveals a small number of high-impact inputs that, could meaningfully improve the overall footprint. Such operational insights may provide cost related advantages beyond environmental ones.

Suppliers who run this process consistently report that the data often surprises them — both in terms of where emissions are actually coming from, and in terms of how competitive their products are relative to the industry averages buyers are currently using.


Where to start and what the first step actually looks like

The most common reason suppliers delay is not cost or complexity, it is uncertainty about where to begin. The data required is unfamiliar, the methodology terminology is unfamiliar, and the fear of discovering something unflattering about your own products is real, though rarely justified.

The practical first step is a data readiness assessment: a structured review of what information you already hold; bill of materials, energy invoices, waste and logistics records, existing supplier data sheets against what a product carbon footprint calculation requires. It usually takes a few days with specialist support and results in a clear picture of what you have, what is missing, and how long the process will take.

From that point, the path to a verified product carbon footprint becomes a defined project, not an open-ended commitment. For most single-component manufactured products, the timeline from data collection to third-party verified output is three to six months. For more complex multi-component systems, it may be longer, but the process scales, and it can start with the product that represents the most significant volume in your sales to the buyers who are already asking.

The Hub of Verified Solutions is structured to support exactly this process. It connects suppliers with accredited methodology guidance, LCA practitioners with marine sector experience, and a platform where the resulting verified data can be communicated directly to the buyers who need it in a format that satisfies the data quality requirements of CSRD reporting.

You do not need to have all your products verified to start or an internal sustainability team. You need a clear picture of your first product, a willingness to collect the data that is almost certainly already sitting in your systems, and a next step.


The bottom line

Your products are already being counted in your buyers’ sustainability reports. The question is whether the number being used reflects your actual performance, or a generic estimate that may be significantly worse.

As regulatory expectations and procurement requirements continue to evolve, verified environmental data is moving from a competitive advantage to a standard business requirement. The suppliers best positioned for this transition will not necessarily be those with the lowest carbon footprint, but those that can demonstrate their performance clearly, credibly and with third-party verification.

Take control of how your products are counted


The Hub of Verified Solutions connects marine and yachting suppliers with the methodology, tools, and platform needed to produce and communicate verified environmental data. If your buyers are already asking or will be asking soon, the Hub is the place to start.


Visit: https://waterrevolutionfoundation.org/programmes/hub-of-verified-solutions/

About this series

The Supplier Knowledge Series is published monthly by Water Revolution Foundation. Each issue covers a specific environmental methodology, regulation, or commercial development relevant to suppliers in the yachting and marine sector. Content is written by environmental specialists and reviewed for technical accuracy.


Welcome Anders Kurten to the Board of Directors

Welcome Anders Kurten to the Board of Directors

We are delighted to welcome Anders Kurtén to the Board of Directors of Water Revolution Foundation.

Earlier this year Anders joined the Board as a leading voice in superyacht services and yacht management, strengthening the Foundation’s connection to a part of the industry that plays a crucial role in turning sustainability priorities into day-to-day operational decisions. Through its direct engagement with owners, captains, crews, and operational teams, the brokerage, charter & yacht management sector offers valuable insight into the challenges, opportunities, and realities shaping yachting today.

As CEO of Fraser Yachts, Anders brings decades of industry experience and a deep understanding of yacht operations, owner priorities, and the evolving regulatory landscape. His expertise will help ensure the Foundation’s programmes remain relevant, practical, and aligned with the needs of the industry.

Anders has also been a strong supporter of YETI, demonstrating a commitment to advancing collaboration and innovation across the sector. His engagement has helped increase industry awareness of YETI and the role data-driven insights can play in supporting progress across yachting.

We look forward to working alongside Anders and benefiting from his experience, insight, and engagement as we continue accelerating positive change across the yachting industry.

Welcome to the Revolution, Anders!

Your Product Is Sustainable. Can You Prove It?

Your Product Is Sustainable. Can You Prove It?

Sustainability is no longer a differentiator in the superyacht industry. It is an expectation. Owners, builders, and designers are being asked by clients, by regulators, and by the market, to make better choices across every stage of a yacht’s life.

There has been a surge in sustainability claims across the industry, from low-emission coatings and recycled composites to energy-efficient systems and bio-based materials. Yet in many cases, independent evidence to support these claims remains limited.

For buyers trying to make genuinely responsible decisions, the market has become harder to read.

Water Revolution Foundation’s Hub of Verified Solutions was built to cut through this.


One Place. Every Part of the Yacht.

The Hub is a single, curated platform of independently verified materials, solutions, and technologies for the superyacht sector. It spans the full scope of yacht building, operation, and refit, from hull and deck materials, propulsion and energy systems, interior finishes, coatings and antifouling, onboard systems, and outfitting and equipment.

If it goes into or onto a superyacht, it belongs on the Hub provided it can be independently verified.

For suppliers, it answers a question that no sales brochure can: what does the environmental evidence actually say about this product?

For builders and designers, it is the reference point they have been missing; a shortlist of solutions with verified environmental credentials, ready to specify with confidence.


Verified Means Life Cycle Assessment (LCA). Not Self-Reported.

The verification behind every listing on the Hub uses comparative Life Cycle Assessment (LCA); the globally accepted methodology for measuring a product’s true environmental impact from production through to end of life.

LCA is what separates verified sustainability from claimed sustainability, by providing a rigorous, data-driven approach grounded in structured, peer-reviewed environmental databases and aligned with internationally recognised standards. Rather than relying on supplier claims, it interrogates the underlying data, working through quantifiable impacts to build an objective picture of performance.

Each assessment is conducted in collaboration with specialist LCA institutes and universities. They are the same academic and research bodies that help develop and validate the methodology itself. This is a combination of in-house, external and expert-led processes and is held to the standards of the scientific community.

Crucially, it is comparative. Products are assessed alongside conventional alternatives and under real-world conditions. The outcome is a specific, quantified, and traceable result that shows the product’s impact relative to a defined benchmark and set of conditions.

This is the kind of evidence that holds up in conversations with owners, class societies, flag states, and anyone who asks the hard questions.


What Verification Means for Your Business

The superyacht supply chain is competitive, with most suppliers offering strong products. Far fewer are able to demonstrate their environmental performance with independent, methodologically rigorous data.

Getting verified on the Hub gives you exactly that.

A credible claim that stands on its own. Your sustainability positioning is backed by LCA, not internal testing or marketing language that could lead to greenwashing. That is a fundamentally different conversation to have with a shipyard or a client.

Visibility where decisions are made. Water Revolution Foundation positions the Hub directly to builders, naval architects, designers, and owners who are exploring specification-ready sustainable solutions. Verification puts your product in that conversation.

Reduced friction in procurement. Buyers who find you through the Hub already have access to your verified environmental data. The due diligence question is largely answered before the first meeting.

A durable market position. Sustainability scrutiny in the superyacht sector is increasing. Suppliers who establish verified credentials are ahead of where the market is heading.


Who Should Apply

The Hub is open to any supplier whose products are used in the building or operation of superyachts, regardless of size or geography. If your product:

  • Is commercially available and used in the superyacht sector
  • Has a demonstrable environmental benefit compared to conventional alternatives
  • Can provide sufficient technical and production data to support an LCA

…you are a candidate for verification.

You do not need to be a market leader. You need a product that performs, and the data to support an honest assessment of it.


The Sector Is Ready for This

The superyacht industry has the technical sophistication and the commercial incentive to lead on sustainability, but progress has been held back by a lack of reliable, independent information. Owners want to make better choices, builders want to specify responsibly, and designers are asking for verified alternatives.

The Hub of Verified Solutions exists to make that possible, one verified product at a time.

If your product genuinely reduces environmental impact, this is where it belongs.


Apply for Verification

Explore the current Hub of Verified Solutions and learn about the verification process at https://waterrevolutionfoundation.org/programmes/hub-of-verified-solutions/

To find out whether your product qualifies or to begin the application process, contact the Water Revolution Foundation team at info@waterrevolutionfoundation.org.

Independent verification is how the market learns to trust what it cannot see for itself. If you have built something genuinely better, make sure the sector knows it.

Why Environmental Sustainability Defines Future Yacht Value

Why Environmental Sustainability Defines Future Yacht Value

Sustainability is no longer a reputational add-on for the superyacht sector. It is now the single most consequential variable in long-term vessel value, charter income, and operational access.

Through the Blue Wake programme of the Monaco Yacht Show we see this shift up close in the verified solutions being adopted, the questions owners and builders are asking, and the growing gap between vessels that can demonstrate their environmental credentials and those that can’t.

Our latest analysis examines the forces driving that gap:
🔹The Mediterranean ECA is in force. Port State Control enforcement is active across the primary summer charter market.
🔹A conventional diesel vessel ordered today will reach the IMO’s 2050 net-zero checkpoint at 20–25 years old, a stranded asset risk buyers are already pricing in.
🔹Hybrid and hydrogen-capable vessels are commanding stronger demand and broader charter pools. The premium for verified sustainability will only grow.
🔹The sector’s most urgent challenge: without independently verified environmental data, buyers and charterers cannot distinguish genuine performance from greenwashing.

The vessels that hold their value and retain access to the world’s most desirable cruising grounds in 2035 and beyond will be those whose environmental credentials can be demonstrated, not just claimed.

Read the full article

The EU’s Advanced Biofuels Capacity Blueprint: What the Data Says – and Why HVO Is Both the Answer and the Problem

The EU’s Advanced Biofuels Capacity Blueprint: What the Data Says – and Why HVO Is Both the Answer and the Problem

Based on the European Commission’s Final Report: “Mobilization of Industrial Capacity Building for Advanced Biofuels” (DG RTD, 2nd February 2026). This article is Water Revolution Foundations key takeaways from the European Commission Report, referred to as ‘the study’.

The Core Question

Can Europe actually build the industrial ecosystem needed to meet its own renewable fuel targets? That is the question at the heart of a substantial new European Commission study, executed by a consortium of EXERGIA, Politecnico di Torino (POLITO), and BEST (Bioenergy and Sustainable Technologies). The short answer is yes, but very nuanced: it will take a coordinated, multi-technology build-out and substantial public financial support that currently isn’t in place.

The study looks at 20 different industrial pathways for producing advanced biofuels. It then evaluates each one based on three main factors:

  1. How mature the technology is
  2. Whether enough feedstock exists to scale it
  3. How much it could realistically contribute to the fuel market

From there, the study builds financial models for the most promising pathways and proposes a collective financing plan to support them. The analysis focuses on two key periods, 2025–2030 and 2030–2040, while keeping the broader goal of EU climate neutrality by 2050 in view.

The conclusion is clear: no single pathway will deliver more than 50% of the fuels needed. Europe requires a portfolio of technologies – from hydrotreatmentHydrotreatmentA refining process that uses hydrogen to convert feedstocks into clean fuels such as HVO and HEFA-SPK, a type of sustainable aviation fuel. to anaerobic digestionAnaerobic DigestionA biological process in which microorganisms break down organic material without oxygen to produce biogas that can be upgraded to biomethane. to pyrolysisPyrolysisA thermal process that heats organic material without oxygen to produce bio-oil, syngas, and biochar, which can be co-processed in refineries into fuels with biogenic content. to gasificationGasificationA thermal process that converts carbon-based materials into syngas (carbon monoxide and hydrogen) using high temperatures and controlled oxygen or steam. and synthesisSynthesis (from Syngas)A chemical process that converts syngas into liquid fuels such as synthetic diesel or aviation fuel. – drawing on the full range of available feedstocks and serving road, aviation, and maritime simultaneously.

Twenty Pathways, Four That Matter Now

Starting from a longlist of 20 industrial value chains (IVC), the study applied four key performance indicators to narrow the field:

🔹Greenhouse Gas (GHG) savings of at least 65% compared to fossil fuels (as required by RED III)

🔹Technology Readiness Level (TRL)Technology Readiness Level (TRL)A scale used to assess the maturity of a technology, ranging from basic research to full commercial deployment. of 9 at least five years before the target period

🔹Feedstock availability sufficient to cover at least 10% of the relevant sectoral target

🔹Expected production deployment covering at least 10% of the EU advanced biofuels target

For the 2025–2030 period, only four IVCs met all four conditions above:

  1. TransesterificationTransesterification (FAME Biodiesel)A chemical reaction where fats or oils react with an alcohol to produce fatty acid methyl ester (FAME) biodiesel and glycerol. → Fatty Acid Methyl Ester (FAME) biodiesel
  2. IVC2 – Hydrotreatment of Lipids → HVO and HEFA-SPK, a sustainable aviation fuel.
  3. IVC7 – Biomethane from Anaerobic Digestion → biomethane
  4. IVC13a – Pyrolysis and Co-processing in Refinery → biogenic content fuels

For 2030 – 2040, the list expands to 13 IVCs as emerging technologies reach commercial maturity. The critical additions include cellulosic ethanol-to-jet, biomass gasification to methanol and methane, Fischer-Tropsch synthesis, and stand-alone pyrolysis upgrading.

HVO: The Most Viable Option, With Caveats

Why HVO Leads

Of all the advanced biofuel pathways assessed, Hydrotreated Vegetable Oil (HVO) (produced via IVC2) stands out as by far the most commercially mature and cost-competitive. This is not a surprise to industry observers, but the study quantifies the gap with precision.

The study gives HVO a TRL of 9, which means the technology is fully mature and ready for large-scale market deployment. It also has the lowest production cost of all the liquid biofuel pathways assessed, at around €103/MWh. FAME biodiesel is close at €119/MWh and, according to the study, can also compete without extra operating support. But HVO still has a stronger overall market position. It works as a drop-in fuel, performs better in cold conditions, and can be used across road, aviation, and maritime applications.

This advantage also shows up in the business case. Among the near-term pathways, HVO is the only fuel that comes close to being commercially viable, assuming it can be sold at prices comparable to fossil fuels and with EU ETS carbon costs taken into account. And when maritime use is included, the case becomes even stronger, because FuelEU Maritime penalties improve the competitiveness of lower-carbon fuels.

The scale also matters. HVO plants are the largest in the study, typically with more than 700 MW of output. Their capital cost is around €1,035 per kW, which is much lower than the €2,500–3,500 per kW range seen for many other pathways. For a 500 kt/year facility producing a mix of HVO, HEFA, naphtha, and LPG, total investment is around €770 million.

Biggest constraint for HVO

The study is candid that feedstock security is the dominant risk for HVO/HEFA. Used cooking oil (UCO), currently the primary feedstock, is constrained in availability and faces increasing demand competition. Expanding to eligible oilseed crops (notably Brassica carinata and camelina, grown as intermediate crops) is the identified scaling pathway, but this requires overcoming a regulatory misalignment between the Common Agricultural Policy (CAP) and RED III.

The two frameworks do not talk to each other well. In practice, this creates unnecessary friction for farmers. Some crops that qualify under RED are not recognised in CAP crop registers. In some cases, farmers who use fallow land for biofuel crops may even risk losing direct payments. On top of that, there is no shared data system or harmonised audit process between the two frameworks. The result is more paperwork, more uncertainty, and less incentive for farmers to participate.

To address this, the study recommends a feed-in premium of €25–40 per tonne for eligible oilseeds to encourage uptake. It also says that aggregators — the actors responsible for collecting, certifying, and delivering feedstock — need support as well, especially for certification and group auditing costs. This is particularly important for smaller cooperatives, which often struggle to absorb the added compliance burden.

Processing materials for HVO also require attention. Hydrogen, catalysts (requiring nickel and molybdenum), and bleaching earths are critical inputs. Catalysts are typically sourced outside of Europe, and supply could become critical at scale. Hydrotreatment Engineering, Procurement and Construction (EPC) companies exist but are currently capacity-constrained due to simultaneous project commitments.

The 2030 – 2040 Expansion

Good to know: by 2040, the list of essential biofuel pathways expands from 4 to 13, with required volumes reaching around 42 Mtoe per year, about 50% higher than 2030 levels.


Overall, the study suggests that a coordinated, system-wide approach is necessary to support the entire sector, rather than addressing individual projects separately.


A key point from the study is that industry feedback pushed cost estimates up significantly for some of these technologies, especially for aviation fuels. And for the synthetic fuel routes, commercial viability depends heavily on much cheaper green hydrogen; something that still looks uncertain.

The Financing Gap: What It Actually Costs

The study’s most policy-relevant output is its estimate of the total financing support required across the four distinct IVCs to meet 2030 targets:

Support CategoryAnnual Requirement (2030)
Upstream (farmers/feedstock mobilization)€700–1,245 million/year
Industrial units (production support)€3,849–7,499 million/year
Total€4,548–8,744 million/year

By 2040, the financial support needed becomes much larger. The study estimates €13,290–20,526 million/year (€13.3–20.5 billion per year) will be required. This is mainly because the next generation of biofuel technologies are more expensive and less mature, and they need to be built at much larger scale.

To make these fuels competitive, the study proposes using a Feed-in Premium (FiP). This means producers receive a payment for every unit of fuel they produce so that the final price can compete with fossil fuels. Europe used the same idea before to help solar and wind energy scale up.

Most of this support — about 85% — would go to the fuel producers operating the plants. The study argues that this is not really “new” cost for the system. In practice, the money simply compensates the gap between renewable fuel costs and fossil fuel prices. Without it, consumers would end up paying more directly through higher fuel prices.

The remaining 15%, €700–1,245 million/year (around €700 million to €1.25 billion per year), would go to farmers and feedstock suppliers. This part is different because it would require new funding, mainly to support farmers growing biofuel crops and the systems needed to collect and certify those feedstocks.

The Skills and Infrastructure Gap

Beyond financing, the study points to another important constraint: Europe does not yet have enough experienced developers to deliver advanced biofuel projects at scale.

The technical knowledge exists. The equipment is available. And many of the skills can come from the refinery and chemical sectors. But what is still limited is the ability to take these projects all the way from concept to delivery, especially for more complex pathways such as gasification, Fischer-Tropsch, and methanol synthesis.

Right now, most of the market attention is going to HVO and HEFA. Other pathways have far fewer companies actively pushing them forward. In biomethane, for example, some developers are focused more on building projects to sell them, than on creating strong long-term business cases. And for newer technologies, the number of EPC companies able to deliver first-of-a-kind plants is still very small.

The picture across Europe is also uneven. Most advanced biofuel activity is concentrated in northern and western Europe, particularly in countries such as Finland, the Netherlands, France, Italy, and Sweden. Meanwhile, south-eastern and central-eastern Europe may have the feedstock potential, but they often lack the industrial base, financing tools, and policy support needed to turn that potential into actual projects.

That is why the study argues that future growth cannot rely only on national approaches. It will require cross-border and regionally connected value chains if Europe wants to scale advanced biofuels more evenly.

What this means in practice is fairly straightforward.

The EU already has most of the building blocks. The technologies exist. The feedstocks exist (From the feedstock suppliers’ perspective particularly agricultural and forestry operators supplying lignocellulosic biomass). And, at least in principle, the financial tools also exist. What is still missing is a joined-up system that supports the sector as a whole rather than treating each project in isolation.

In the near term, HVO is the clearest opportunity because it is the most mature and needs the least support. But HVO alone will not be enough. It cannot cover the needs of road, aviation and maritime on its own, and relying too heavily on it would slow down the development of the lignocellulosic and synthetic pathways Europe will need after 2030. It would also risk concentrating most of the industrial activity in a small group of countries.

That is why the study argues for investment across the full portfolio. Not because every pathway is equally strong today, but because only a mix of pathways can deliver the volumes, serve different sectors, and make use of the range of available feedstocks.

This is based on the European Commission Final Report “Mobilization of Industrial Capacity Building for Advanced Biofuels,” published by DG Research and Innovation (Horizon Europe Programme), 2026. Authors: EXERGIA, POLITO, BEST. Edited by Maria Georgiadou (EC), Theodor Goumas (EXERGIA), David Chiaramonti (POLITO).

Click here for the official European Commission article.