Following the monumental third edition of its strategic business leaders gathering last month, the foundation publishes the Roadmap 2050 setting quantified environmental targets with five-year increments to reach net-zero by 2050. The way it is set up engages all yachting sector stakeholders and follows the approach of a yacht’s life cycle of Design, Build, Operation and Refit.
Water Revolution Foundation is announcing the Roadmap 2050: Towards Regenerative Yachting. This roadmap represents a collective, yachting sector-wide effort to reach net-zero emissions by 2050 latest. Developed through collaboration, following the Life Cycle Approach and based on a unique data exercise, the Roadmap covers every stage of a yacht’s life cycle—Design, Build, Operation, and Refit—with clear, measurable targets set in five-year increments. The Roadmap provides a path towards net-zero for both product and process.
United through a specific environmental strategy for the yachting sector
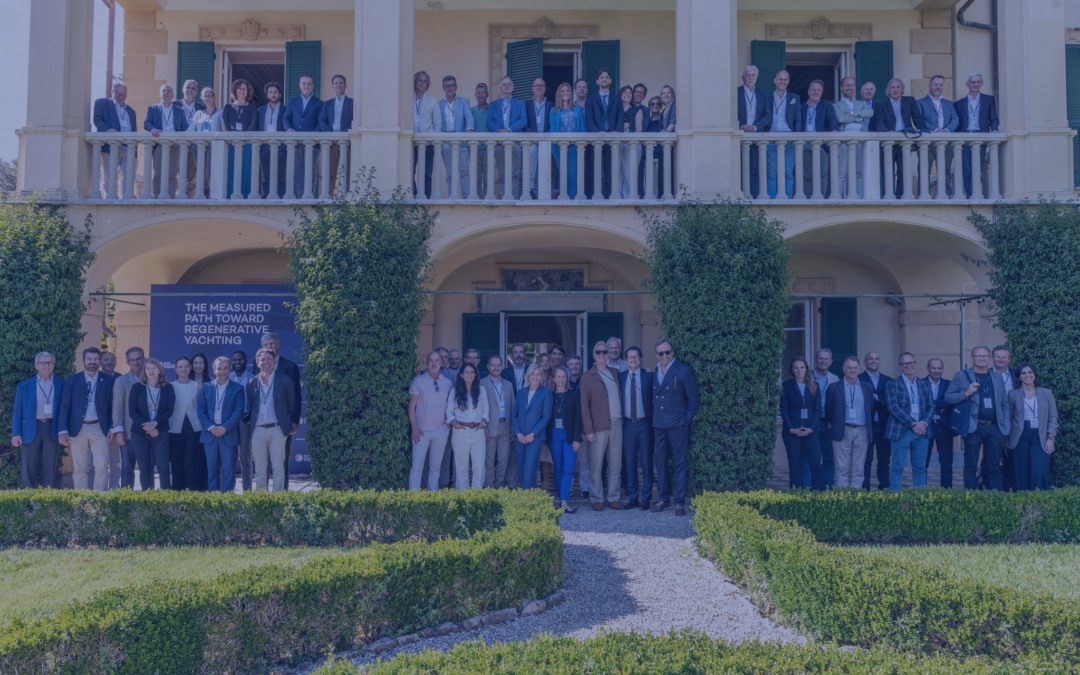
With overwhelming support for the Roadmap 2050 from the great mix of business leaders present at the third edition of the foundation’s strategic platform for top 60 industry CEOs, last month in Lerici – Italy, hosted by Sanlorenzo, the foundation calls upon all industry stakeholders to embark on this collective journey together. Robert van Tol, executive director of the foundation explains: “The Roadmap 2050 is a compass to navigate together through what are, undeniably, unchartered waters. Yachting can and should be pro-active and openly commit to net-zero, by latest 2050. Coordination and collaboration is key to accomplish this.”
Building on the momentum of two previous gatherings in Hamburg (2023) and Amsterdam (2024), this year’s edition marked a significant shift—from awareness to implementation. The focus turned to embedding regenerative principles into operations, investment decisions, and lifecycle strategies across the full yachting value chain.
Renowned environmental advocate Céline Cousteau opened the third edition with a powerful keynote, that underscored the intrinsic connection between humanity and the ocean. Drawing from her intergenerational legacy and frontline experience in marine conservation, Cousteau’s message resonated deeply with an industry uniquely dependent on ocean health.
“Regenerative practices in the yachting industry are essential for the health of our oceans and the well-being of future generations. This industry possesses the power, influence, and resources to lead by example. If yachting can transform, no other sector will have an excuse not to follow,” stated Cousteau, receiving a standing ovation.
While the Roadmap goes beyond current regulatory thresholds, it remains voluntary—empowering the industry to chart an optimal course. It is a sector-specific environmental strategy, uniting us all, giving clear directions for companies and individuals active in any of the four life cycle stages. Through quantified targets priorities are set and guidance provided where to work towards and what to focus on. It is aimed to spark innovation, forward thinking, competition, collaboration and standardisation. Suspended EU reporting requirements and IMO thresholds for vessels still over >5,000 GT for the moment should not result in “wait and see”, but in extra motivation to utilise the opportunity to embark on a yacht-specific path towards net-zero now we still can.
The white paper of the third business leaders event is available here for transparency and broader industry engagement.
The projected journey
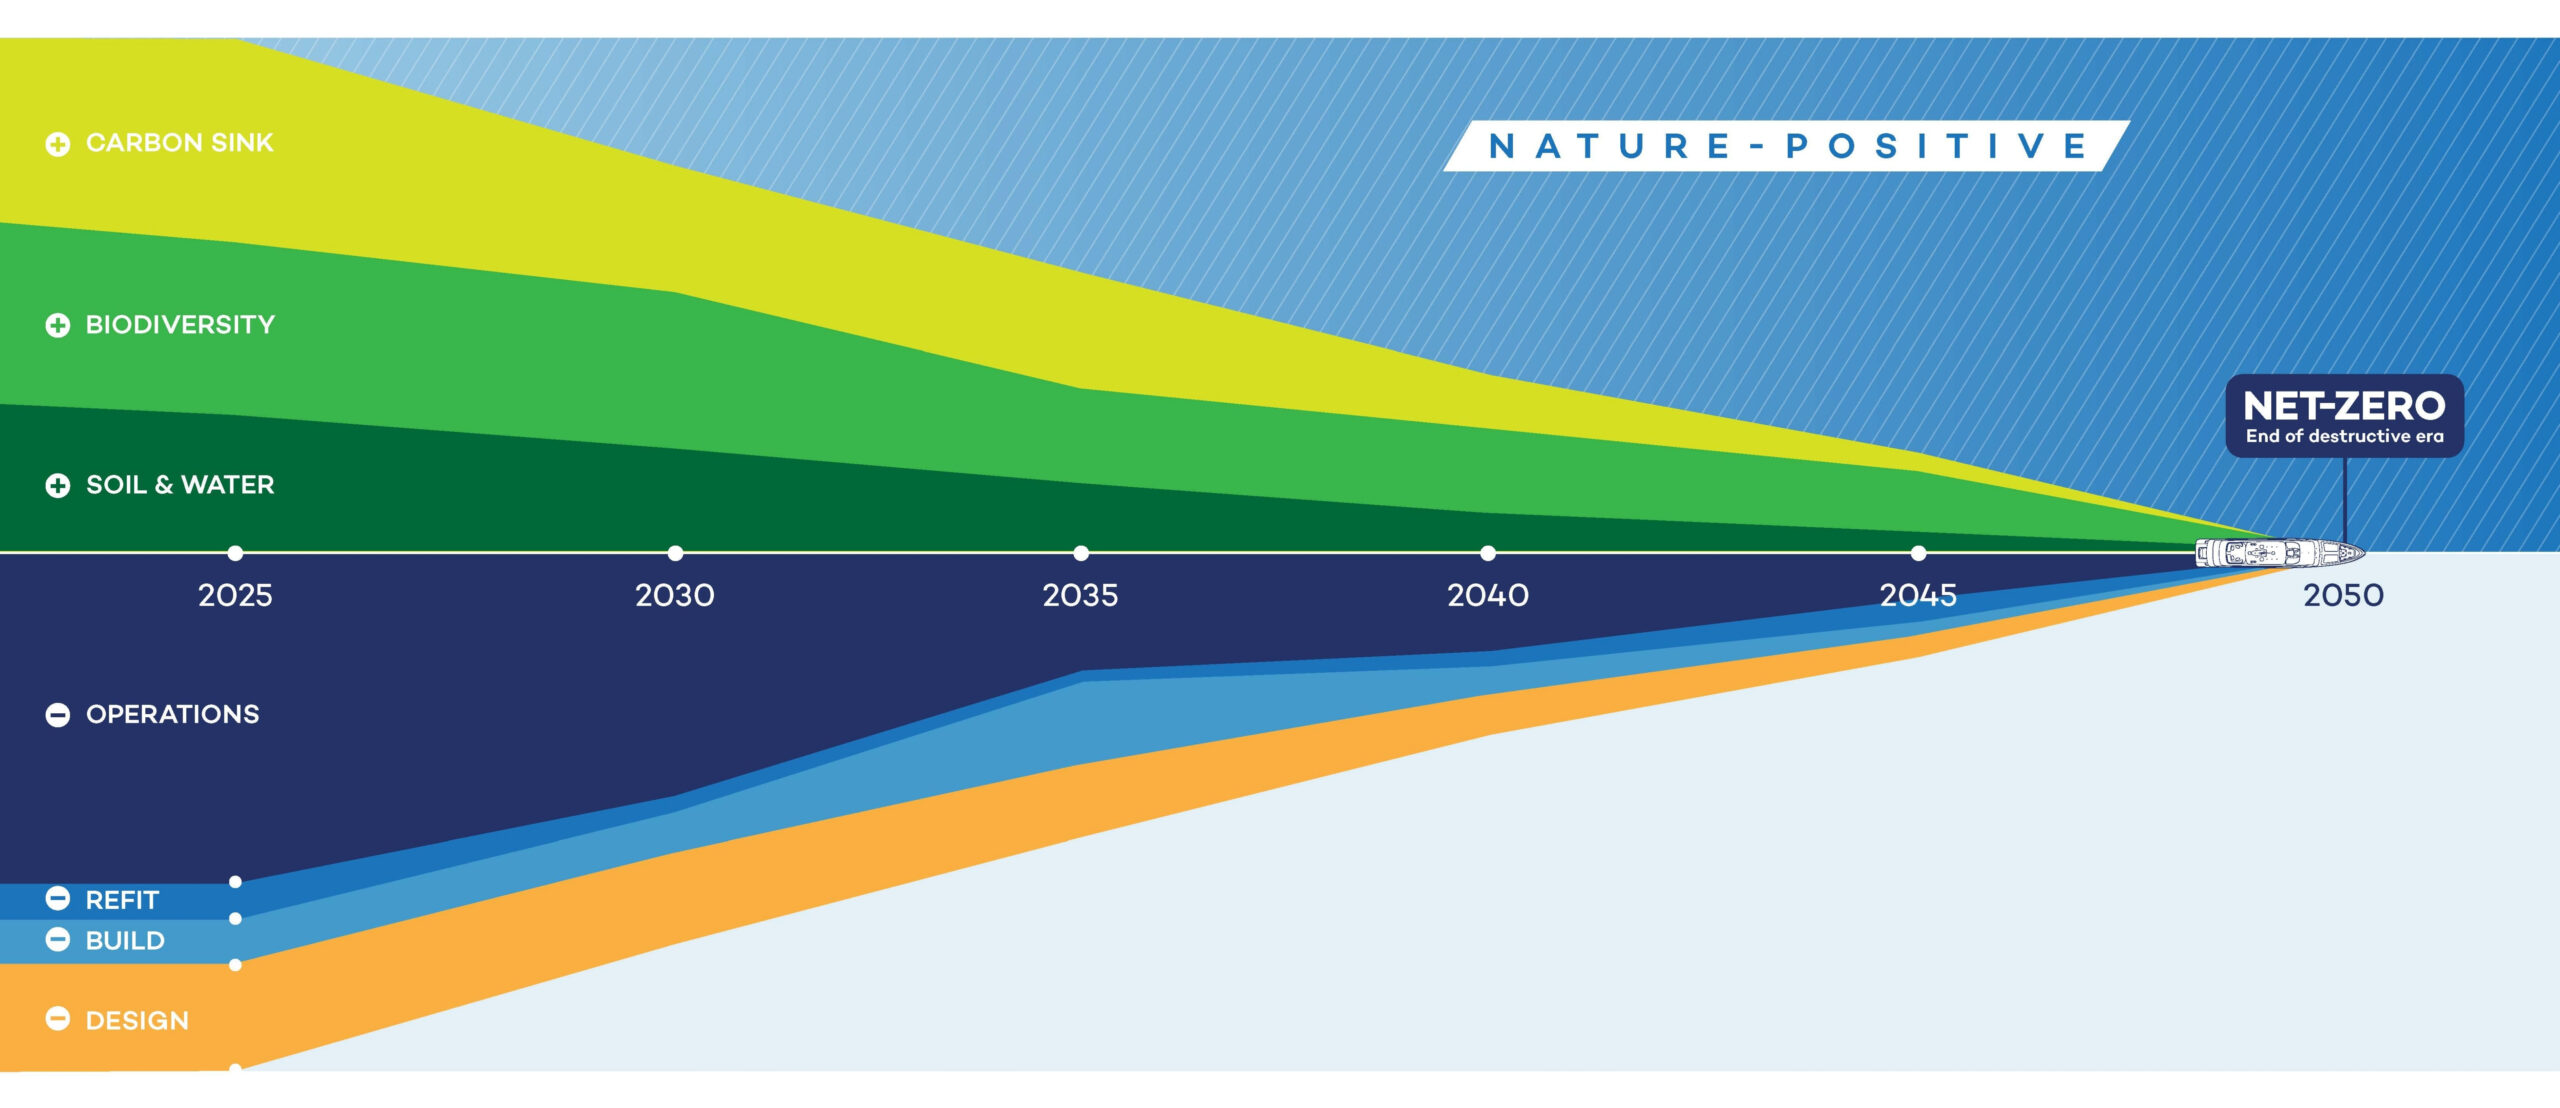
To define the 2025 baseline, Water Revolution Foundation gathered data from Designers, Builders, Operators, and Refit yards. This data was used to estimate the current shares of impact and set proportional targets—measured in percentage reductions rather than absolute numbers—for each life cycle stage. This marks the first step in a process that will become increasingly detailed with broader industry participation.
Reader guide: The Roadmap visual shows the current estimated negative impact division among the four life cycle stages in 2025 below the x-axis, and their declining trajectories towards 2050. Above the x-axis is the mirror, representing the required positive impact investment in carbon sequestration, biodiversity restoration and contaminated soil & water, to neutralise the negative impact. This can and should be done at any point in time to reach net-zero asap. Robert van Tol clarifies: “Compensation is not the first thing to do, but certainly should be the last thing. Reduction efforts of negative impacts should always come first.” When going beyond compensating the negative impact, one reaches a nature-positive effect.
To facilitate effective compensation efforts, the Ocean Assist programme will offer a structured investment mechanism for ocean restoration. This yachting-specific blue finance approach is set to maximise financial and non-financial resources to support nature-based solutions and aid the global effort to restore ecological impacts. The Ocean Assist programme enables the yachting community to make measurable, regenerative contributions to global ocean agendas—redefining the relationship between economic growth and ocean well-being. More about this later this summer, when this yachting sector-specific ocean conservation programme will be launched.
Dr. Vienna Eleuteri – initiator & vice chair of Water Revolution Foundation adds: “The Roadmap is a shared promise—to each other, to the ocean, and to future generations. A promise of transparency, collaboration, and real progress.”
What is next?
To effectively track progress, yachting needs a centralised, standardised data monitoring system. This system should be designed for collective benefit—allowing participants to track their own progress, benchmark it against their peer group and as such contribute to monitor the overall sector trajectory toward net-zero.
Selecting the right KPIs, determining the scope for the data submission to enable comparison, utilising existing sources, and setup a frequent data collection mechanism for monitoring is what needs to happen within 2025 with a critical mass of industry players. For each life cycle stage (design, build, operation and refit), Water Revolution Foundation will utilise its current or setting up new roundtables to progress. All related trade associations are encouraged to embed the Roadmap targets in their agendas and are most welcome to join these roundtables. Signing up is not a contract, rather a moral statement and a true unified approach.
Further, it’s important to remember that these life cycle stages are not isolated. One very much influences the other. Yet, we need to divide the pie of impact in order to allocate and take responsibility for it. This awareness and ownership of impact is expected to result in much better informed decisions and environmental innovation in each and every corner of the yachting sector.
Vienna Eleuteri concludes: “The Roadmap signals to the world that our industry is not waiting for change—we are leading it.”
Water Revolution Foundation will be organising a webinar to explain the Roadmap 2050 and onboard the wider yachting community on this collective journey. Please register here, further information will be shared shortly.
We are elated to be heading to the UN Ocean Conference next week!
As part of our mission in advancing ocean regeneration through industry transformation, Water Revolution Foundation (WRF) – with Special Accreditation to access high-level sessions and policy roundtables in the exclusive Blue Zone – will be actively contributing to the lead-up and formal participation in the Third United Nations Ocean Conference (UNOC3), held in Nice, France from 9 to 13 June 2025.
Reporting from the grounds of this key conference, our delegation will be composed of Henk de Vries, Chairman at WRF, Dr Vienna Eleuteri, Initiator and Vice President of WRF – and architect of the Ocean Assist Programme, Jorge Barbosa, Blue Economy Advisor – former UN DESA & World Bank expert, and Laurie Foulon, Strategic Partnerships & Communications Lead of the Ocean Assist Programme.
Dr Vienna Eleuteri is also participating in speaking engagements at the Blue Economy and Finance Forum (BEFF), preceding the Conference on 7 & 8 June, in Monaco.
Reporting from the inside
Our engagement is anchored in announcing the Ocean Assist programme, formally submitted as a Voluntary Commitment under SDG 14 (Sustainable Development Goals 14: Life below Water), and structured to scale measurable regenerative impact from the yachting sector into global ocean agendas. The Ocean Assist programme bridges mandatory compliance (EU ETS, IMO MEPC 83) and voluntary leadership.
📅 7–8 June 2025: Monaco Blue Economy & Finance Forum – speaking engagements, under private invitation from Prince Albert of Monaco
📅 9-13 June 2025: attending Green and Blue Zone events, speaking on different panels and roundtables, honouring invitations to exclusive receptions.
📅 13 June 2025: hosting the official Ocean Assist side event with UNCTAD: United Nations Trade and Development – please click here for the event programme and to register. We will be joined by a panel of speakers, including from the University of Genoa, UN Trade and Development (UNCTAD), IUCN World Commission on Protected Areas (WCPA), TETIS Institute Srl and Project Seagrass.
What is Ocean Assist?
“Integrating regenerative investment into our businesses’ value propositions is the way to preserve a future for all” – Dr Vienna Eleuteri, Project Lead, Ocean Assist.
Ocean Assist is Water Revolution Foundation’s new programme that channels financial and strategic support from the maritime industry into scientifically validated marine restoration projects. This blue finance mechanism, containing a Standard, curated portfolio, and “units” as its currency, enables stakeholders to offset their ecological footprint while promoting biodiversity, carbon sequestration, and sustainable ocean practices. Ocean Assist is in support of the Regenerative Blue Economy, redefining the relationship between economic growth and marine conservation by prioritising restoration and resilience over sustainability.
By curating projects and adopting scientific tools that are urgently needed to protect the oceans, the superyacht community can maximise financial and non-financial resources to support nature-based solutions and aid the global effort to mitigate ecological impacts: leading the way towards net-zero, empowered to reach nature-positivity.
This collective and traceable approach includes coordination, shared structural commitment, and guidance by leading scientists in the field, seamlessly integrating into the industry’s Regenerative Roadmap 2050.
In practice
Going beyond sustainability, each Ocean Assist Unit combines 1t of CO2 in the form of tradeable carbon credits (VERs), with 1t of CO2 as Regenerative Contribution Units (RCUs): resulting in 1 Ocean Assist Unit repairing the equivalent of 2t of CO2 emitted, protecting biodiversity directly linked to the yachting industry’s supply chain.
All initiatives contributing to the Ocean Assist portfolio undergo independent scientific evaluation and are aligned with the Ocean Assist Standard through a rigorous screening and monitoring process, truly aligning the Programme with Global Ocean Governance.
The Ocean Assist Standard itself is:
Scientifically validated and certified by RINA
Managed by a dedicated team within Water Revolution Foundation
Registered and transacted on the Eco2Care climate registry.
Upon transaction, an organisation buying Ocean Assist Units will be attributed official recognition via verified certificates: a Certificate of Permanent Withdrawal (VER), and the Ocean Assist Standard Certificate (2 tCO₂eq contribution).
A mechanism to serve the 3-R Model towards Regenerative Yachting
Following the 3R concept of Reduce, Remove and Restore, instilled in the Foundation by Dr Vienna Eleuteri, the Ocean Assist Programme was setup to support compensation efforts that move the industry toward nature-positive outcomes.
Moving away from the controversial carbon credit model, stakeholders are encouraged to acquire Ocean Assist Units once any optimisation pathways within one’s supply chain or onboard operations to Reduce or Remove has been exhausted: not replacing these measures.
We invite any stakeholders of the yachting and maritime industries, captain and operators of yachts and superyachts, to take the next collective step to lead voluntary commitment of ocean conservation.
We are delighted to welcome Aino Grapin to our board!
Aino brings an impressive 25 years of experience leading and growing businesses within the creative industries, spanning the arts, luxury, and technology sectors.
“I am honoured to join the Water Revolution Foundation board alongside an outstanding group of superyacht leaders, united in our commitment to advancing sustainability in our industry through collaboration and innovation. After leading the Sustainable Yacht Design Taskforce for the past four years, I look forward to deepening my involvement with WRF and further driving positive change within our industry.”
As Chief Executive of Winch Design, a position she’s held since 2016, Aino has demonstrated exceptional leadership, including guiding the company through its transition to employee ownership in 2021.
We would like to extend a warm welcome to Martijn Munniksma!
Martijn brings extensive expertise in international tax law, including deep knowledge of restructurings, controversy, refinancing, rationalization, new business models, and supply chain optimization.
‘‘I’m delighted to have been accepted as new treasurer & secretary of this beautiful foundation. I look forward contributing to and working with all team members and other stakeholders to further incentivize our joined, common commitment to preserve oceans and reduce the footprint of the yachting industry.’’
His current role is a Tax Partner in the International Tax Practice at EY Amsterdam. He has been with EY since 2006 and has completed two secondments to the Dutch desk in New York.
We look forward to working alongside Martijn. Welcome aboard!
Author: Awwal Idris, Environmental Expert at Water Revolution Foundation
Highlights
HVO offers up to a 90% reduction in CO₂ emissions (well-to-wake) compared to fossil diesel; the CO₂ produced during HVO combustion is biogenic in origin and reabsorbed in the carbon cycle, unlike diesel that adds “new” CO₂ to the atmosphere, contributing to global warming.
HVO is a drop-in fuel fully compatible with existing diesel engines and requires no modification. Most leading engine manufacturers in yachting have certified their diesel engines for HVO use.
HVO also reduces harmful local air pollutants, including particulate matter (PM) and nitrogen oxides (NOₓ), while containing no sulphur or polycyclic aromatic hydrocarbons (PAHs).
Sustainable sourcing and certifications like ISCC or REDcert ensure HVO is produced responsibly, minimizing environmental impact and supporting a circular economy.
Disclaimer: HVO is a valuable resource in reducing emissions. However, we encourage reducing onboard energy demand first and foremost; avoiding just switching fuel type for reduced emissions only.
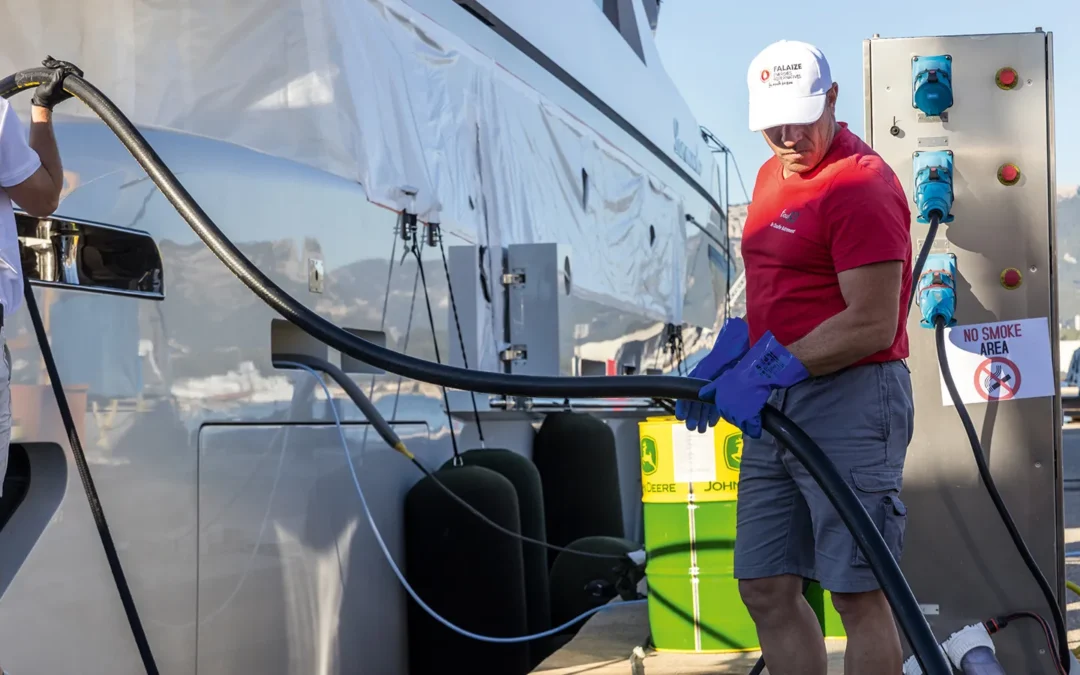
Demystifying Hydro-treated Vegetable Oil (HVO): An immediate solution for significantly reducing yachts’ environmental impact
Internal combustion engines, mostly powered by fossil fuels, are still the primary energy source for many industries, including boating and yachting.
But as our society evolves and the scientific community reliably measures the impact of our reliance—its significant pollution and greenhouse gas emissions—our industry is at the forefront of responding to the urgent need for new technology and policy changes.
This article explores HVO as one opportunity for transition, its potential role in reducing emissions within the superyacht industry, including specific examples for superyachts.
Phasing out diesel
In Europe and worldwide, diesel engines are widely used for their greater efficiency, which allows them to produce 10–40% less CO2 than gasoline engines. However, diesel engines struggle to meet strict emissions standards, such as the International Maritime Organization Tier III, which sets limits on nitrogen oxide (NOₓ) emissions from marine diesel engines. For yachts, this challenge arises from the unique operational hours of yachts, which often involve prolonged periods at low engine regimes. As a result, emissions control systems like selective catalytic reduction (SCR)—which need to attain a high temperature for efficacy (240-450°C)—are less effective in reducing NOₓ and particulate pollution. Most yachts with engines above 130 kW would need a modern SCR system to meet Tier III regulations when operating in designated Emission Control Areas (ECAs), where strict NOx limits apply. Plant-based biofuels offer a promising way to reduce emissions. Biodiesel, often called FAME (fatty acid methyl esters), a first-generation biofuel, is the most common alternative to regular diesel. It’s made from crops like soy or rapeseed using a process called transesterification. Biodiesel helps reduce pollutants like carbon monoxide, unburned hydrocarbon (HC), and particle emissions. However, it has drawbacks: it breaks down more easily, performs poorly in cold weather, and can damage fuel system parts. Due to these issues, the EU limits biodiesel blends with regular diesel to a maximum of 7%.
Hydrotreated Vegetable Oil (HVO)—a paraffinic fuel made from diverse bio-based feedstocks (second generation), such as plant oils, animal fats, and waste materials—avoids many of biodiesel’s problems. Made by treating vegetable oils with hydrogen, HVO produces fuel similar to regular diesel but without sulphur or other pollutants. Making HVO is also cheaper than making biodiesel, and it works easily in standard diesel engines without any modifications required. Most prominent engine manufacturers active in yachting have recently certified most of their engine models for HVO. In fact, HVO can be mixed with diesel in any amount or even used 100% on its own without major engine adjustments. Many research studies [1,2] have highlighted the potential advantages of HVO with respect to FAME and regular diesel.
What is HVO (Hydrotreated Vegetable Oil)?
Hydrotreated Vegetable Oil, commonly known as HVO, is a renewable fuel produced from feedstocks like vegetable oils, waste fats, and animal fats. HVO is created through a process that treats these feedstocks with hydrogen in the presence of a catalyst, removing oxygen and producing hydrocarbons similar to those in traditional diesel. The resulting fuel has properties that closely resemble fossil diesel but lacks sulphur and other harmful compounds like polycyclic aromatic Hydrocarbons (PAHs), which are present in fossil diesel. HVO has a much lower carbon footprint over its entire lifecycle because it uses renewable resources and emits fewer greenhouse gases (GHGs).
Key benefits of HVO
One major advantage of using HVO as fuel is the significant reduction in CO₂ emissions it offers. Here is an example: let’s assume a superyacht operated for about 1,500 hours and consumed 300 litres of fuel per hour. If this superyacht runs on conventional diesel, its CO₂ emissions would be around 1,205,380 kg CO₂. This is roughly equivalent to the emissions of 903 average European new passenger cars or the annual carbon footprint of about 166 European citizens.
It’s important to note that these emissions account only for diesel combustion in the yacht’s engines used for propulsion and do not include the generators for the “hotel power”—essentially the non-propulsion needs onboard, such as heating, cooling, lighting, and appliances, all of which are vital to the comfort and functionality of the vessel. If we were to factor in both propulsion and hotel power, the total emissions would, on average, double. When viewed in the context of the global superyacht fleet, these emissions highlight the importance of pursuing solutions that can mitigate emissions.
HVO offers a promising solution for reducing these emissions, with up to a 90% reduction in CO₂ emissions compared to fossil diesel over its entire lifecycle. This includes emissions from sourcing and production (well-to-tank) to combustion in the engine (tank-to-wake). The exact reduction percentage can vary based on factors such as feedstock type, production process, and specific supply chain emissions.
While HVO and diesel release comparable amounts of CO₂ during combustion, the key difference lies in the source of the carbon. HVO emits biogenic CO₂, which comes from plant-based materials that absorbed CO₂ during their growth. This creates a short-term carbon cycle, where the CO₂ released is reabsorbed through natural processes like photosynthesis. In contrast, the CO₂ from diesel combustion comes from fossil sources—carbon that has been locked away for millions of years. Once released, this “new” CO₂ remains in the atmosphere, adding to the long-term carbon load and contributing to climate change.
HVO’s lower carbon intensity is particularly evident in the well-to-tank stage, especially when sustainable, waste-based feedstocks are used.
By switching to HVO with a conservative 80% CO₂ saving (well-to-wake), this example superyacht could save approximately 964,300 kg of CO₂—a reduction equal to the yearly emissions of about 133 EU citizens. This saving is also comparable to the emissions from around 723 average new European passenger cars.
The potential reduction in CO₂ emissions achieved by transitioning to HVO demonstrates the significant positive impact low-carbon fuels can have on the yachting fleet industry’s overall carbon footprint. As more vessels adopt HVO, this shift could play a crucial role in advancing the sector’s decarbonization efforts.
Renewable and Sustainable Feedstocks: HVO is produced from renewable sources, primarily waste oils and fats, which significantly reduces our reliance on fossil fuels. It’s important to differentiate between primary (or virgin) feedstocks, like soybean or palm oil, and byproducts from waste materials. Virgin feedstocks require considerable land, water, and energy to produce, often leading to environmental concerns such as deforestation and competition with food crops. In contrast, byproducts like Used Cooking Oil (UCO) and animal fats are often discarded; using these materials not only minimizes waste but also reduces the need for new resources. This approach helps achieve greater carbon savings, as waste-derived feedstocks typically have lower lifecycle emissions. By prioritizing these more sustainable options, HVO production supports a circular economy. Yet the secondary status of the feedstock is critical for this to work as such.
Less Emissions. When used in diesel engines, HVO produces much less air pollution compared to regular diesel. HVO can cut carbon dioxide emissions by up to 90% (W-T-W, depending on its feedstock and production), reduce particulate matter by 40-80%, and lower nitrogen oxides (NOₓ) by an average of up to 8% without any engine modification [3]. Additionally, it contains no sulphur or PAH compounds, making it a cleaner alternative overall.
Compatibility with Diesel Engines: HVO can be used in existing diesel engines without modification, making it an immediately applicable solution for reducing emissions across the superyacht industry. This is particularly advantageous for the existing superyachts in the fleet, where environmental upgrades to onboard systems can add cost and complexity. HVO might come at an upcharge in some countries, but more adoption will result in lower costs. The yachting community can pioneer the uptake of HVO for the larger society to benefit from increased availability and more competitive pricing.
Certification is crucial
The Renewable Energy Directive (RED), introduced by the European Commission in 2008, sets mandatory sustainability standards for biofuels, including HVO. These standards establish minimum requirements for reducing greenhouse gas emissions and guidelines for assessing the risks of Indirect Land Use Change (ILUC) associated with different feedstocks.
When first-generation biofuels are produced from crops grown on existing farmland, the demand for food and feed crops doesn’t disappear. This can lead to increased food production in other areas, potentially resulting in land use changes, such as converting forests into agricultural land, with deforestation, significant release of CO2 emissions, and biodiversity loss as a result. For second-generation biofuels such as HVO, these are produced from non-food sources, like agricultural waste, wood chips, and other residual biomass. Since they do not rely on food crops, they typically have a lower impact on food supply and are less likely to drive land-use change for agriculture. However, if second-generation biofuel production scales up significantly, it could still indirectly influence land use by increasing demand for certain waste products or residuals, but this is still generally less impactful compared to first-generation biofuel.
Certification for first-generation biofuel verifies that feedstocks are responsibly sourced, minimizing competition with food crops and reducing negative land-use impact like deforestation. It also verifies that the biofuel meets required GHG savings. For second-generation biofuels, certification guarantees that feedstocks come from non- food, waste, or residual sources, helping avoid land-use changes related to food production. It ensures transparency and traceability in the supply chain, proving that materials are sustainably sourced.
To verify that biofuels (both first and second generation) are truly a sustainable alternative to fossil fuels, RED II outlines specific criteria for the sourcing and environmental impact of biofuels sold in the EU. The key requirements under RED II are:
Transport biofuels must achieve a greenhouse gas (GHG) savings of at least 65% compared to diesel.
Biofuels used for electricity, heating, and cooling need to have a GHG savings of at least 80%.
Biofuel producers must obtain certification from an independent third party to demonstrate compliance with these standards. This certification process includes auditing the entire supply chain to ensure that sustainability and sourcing criteria are met. Additionally, producers and suppliers are required to submit regular reports to confirm ongoing compliance to the certification requirements and RED II regulations.
What does it mean for me as a superyacht owner or operator?
For superyacht owners and operators looking to purchase HVO fuel, it is essential to know what questions to ask suppliers when ordering HVO. Below are some key considerations for due diligence that yacht owners and operators should keep in mind or inquire about when sourcing HVO fuel:
Ask for a certification scheme recognized by the EU RED: There are several certification organizations that comply with RED II regulations and criteria. Some of the most well-known include the International Sustainability and Carbon Certification (ISCC), REDcert, and the Roundtable on Sustainable Biomaterials (RSB). These certifying bodies not only adhere to the standards set by RED II, but they also engage independent third parties to conduct audits and certify compliance with both RED II and their own certification schemes. By choosing certified suppliers, you can ensure a thorough audit of the supply chain that aligns with regulations and contributes to real CO2 savings.
Request impact assessment documentation: More biofuel-producing companies are now focused on calculating the actual greenhouse gas (GHG) emissions across their entire supply chain using a full lifecycle assessment (LCA) approach. This allows them to effectively communicate their environmental footprint to stakeholders and customers, as lower emission-intensity fuels are increasingly advantageous for business owners. By reviewing this information, one can gain insight into the GHG savings associated with their biofuels, as well as the potential Indirect Land Use Change (ILUC) impacts linked to their supply chain. A low ILUC risk suggests that the production of biofuels did not interfere with food production or encroach on ecologically sensitive areas like forests.
As we work towards the goal of net-zero emissions by 2050, the operation of yachts is evolving. Using HVO can offer an immediate and significant reduction in emissions and is therefore highly recommended to be adopted widely by the international yachting community as the new fuel for yachts.
As we work towards the goal of net-zero emissions by 2050, the operation of yachts is evolving. Using HVO can offer an immediate reduction in emissions and thus needs to be adopted widely by the industry.
We use cookies on our website to give you the most relevant experience by remembering your preferences and repeat visits. By clicking “Accept”, you consent to the use of ALL the cookies.
This website uses cookies to improve your experience while you navigate through the website. Out of these, the cookies that are categorized as necessary are stored on your browser as they are essential for the working of basic functionalities of the website. We also use third-party cookies that help us analyze and understand how you use this website. These cookies will be stored in your browser only with your consent. You also have the option to opt-out of these cookies. But opting out of some of these cookies may affect your browsing experience.
Necessary cookies are absolutely essential for the website to function properly. This category only includes cookies that ensures basic functionalities and security features of the website. These cookies do not store any personal information.
Analytical cookies are used to understand how visitors interact with the website. These cookies help provide information on metrics the number of visitors, bounce rate, traffic source, etc.